Object The object of the following experiment is to prove conclusively that the varroa population in a colony of honey bees is limited sufficiently by natural grooming and hygienic behaviour by the bees, to enable co-habitation, without any other form of treatment. Theory for Bee Population 1. During the winter (mid Oct-Feb) the queen lays no eggs.
2. During March-May the queen lays continuously about 1000 eggs per day.
3. About 2000 drone eggs are laid mid April.
4. Bee numbers increase from 10,000 to 40,000
5. The colony swarms once at the end of May.
6. This results in a two week gap in egg laying.
7. The new fertile queen commences egg laying at 1000 per day for
about 9 weeks, then in reduced numbers for a further 9 weeks
spanning the period mid June to mid Oct.
Theory for Varroa Population 1. During the winter period Oct-Feb, when the bees and varroa are dormant, there is no grooming. The varroa drop during this period is the result of bees dying and the dead bee and the live varroa fall to the floor, where the live varroa dies. About 1/3 of the bees die and 1/3 of the varroa follow suit. 2. During March - May there is little grooming if the bees are over stressed and under these conditions the varroa drop during this period consists mainly of the remaining 2/3 dying from old age. If the colony started the winter with 300 mites, 100 would drop Oct - Feb and the other 200 March - May. March - May gives the varroa 13 weeks of perfect breeding conditions. 3. Allowing a female varroa 3 cycles of 2 weeks in cells breeding and 2 weeks outside resting, breeding 1 viable daughter in worker brood and 2 viable daughters in drone brood, 200 varroa become 1,800 during this period and can show a daily varroa drop of only 2. Having 200 mites on the 1st March with the queen laying around 1,000 eggs per day on natural comb, during the second week all 200 varroa should have entered cells. They would be 'in phase', so in week 3 all varroa would be inside cells and none observable outside. If the offspring followed suit this would be repeated during weeks 7 and 11 etc. This could explain swarms free of varroa when the hive is heavily infested.
4.      During the 2 weeks of varroa nest site absence, caused by the
        swarm issuing at the end of May two things occur.
        (a). Varroa are more active, looking for nest sites, and therefore
        more vulnerable.
        (b). Many nurse bees are available for grooming. At this time
        about 50% of the varroa lose their lives due to this situation.
        When nest sites become available, multiple mite infestation
        causes cells to be uncapped. The mother survives but has lost
        one of her three reproduction cycles and becomes 'out of phase'.
5.      During mid Aug - mid Oct brood rearing is much less and
        grooming and uncapping much more and the varroa gradually become
        further and further 'out of phase'.
6.      The daily varroa drop eventually equals the daily varroa birth
        rate and a balanced situation occurs and the varroa population
        stabilizes.
7.      When all egg laying has ceased, the mites exiting cells have to
        remain outside continuously and are now liable to be groomed
        until the bees cluster and the varroa take up their
        over-wintering mode. During this period the groomed varroa are
        not replaced and if the varroa drop in Sept was 400 per week
        indicating a balanced situation of 1,600 varroa and the winter
        varroa drop figure was 5 per week, this would suggest that the
        last 4 weeks of large varroa drop figures are irreplaceable and
        equal to about 1,300 varroa.
8.      There is therefore no over all increase in the varroa population
        on an annual basis.
Method

During the year 2000 a number of swarms were collected and housed in
'GM' and 'HT' hives. The experiment will be conducted with three of
these hives numbers 11, 13, and 15 which appear to be of similar strength.

Hive No 11 was collected on the 4th June from Blackmore End.
Hives No 13 and 15 were collected on the 7th June from Halstead and
Hawkwood respectively.

Each week commencing from the 4th Feb the floor debris of each hive
will be inspected.
The number of varroa will be recorded and the presence of dead embryo
bees (worker & drone) will be noted.

It is intended that any swarms from these hives will also be monitored
for weekly varroa drop etc.

Samples of dead bees and varroa from these hives are available upon request.
It is the expectation that the results, yet to be obtained in the forthcoming
year, will show that the varroa population, in an untreated hive, does not
follow an exponential curve.
It is also hoped that the reason for this apparent phenomena will be made
clear by the results following the varroa population theory.

The results up to the current time are shown below- 04/02/2001 - 06/02/2002
Notes from the author at each monthly update <READ NOTES>
|
|
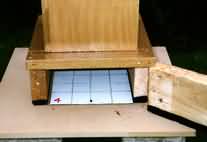 Picture
(left) shows the method of obtaining the weekly varroa drop count.The
board is 10in square and divided up into sixteen 2 1/2in squares to
assist in counting with a hand held lens. Picture (right) shows a close
up of the original 'GM' hive.
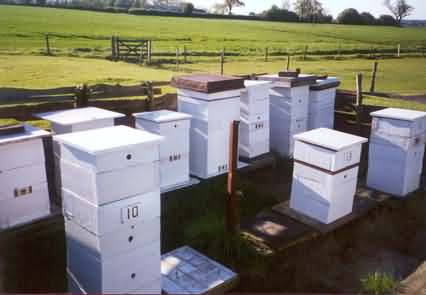
Picture
(left) shows the method of obtaining the weekly varroa drop count.The
board is 10in square and divided up into sixteen 2 1/2in squares to
assist in counting with a hand held lens. Picture (right) shows a close
up of the original 'GM' hive.
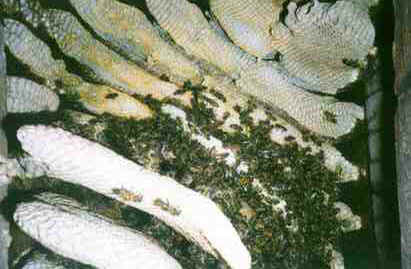
Picture (above) shows natural comb inside an 'HT' hive |

|
Author: Ian Rumsey Address: Morris Green Farm,
Sible Hedingham, Halstead, Essex, C09 3LU
Email: ianrumsey@hotmail.com
Back | Beedata Home |
|
 The graphs will be updated 4 weekly.