2nd
April 2001
Please find enclosed up dated graphs for the 'Varroa Experiment'.
Unfortunately Hive No 11 ,which was a 'GM' hive succumbed to
the ravages of winter.
Hive No 10 a similar 'GM' hive has been submitted as a replacement.
Photos of these two hives appear in the 'Development of the GM hive'
Hive 10 used the bottom entrance only while Hive 11 used the top entrance.
Perhaps heat loss with a top entrance caused the failure as Hive 11
had the greater number of bees but just run out of stores, whereas Hive
10 showed very little activity regarding wax crumbs etc noticed whilst
doing the varroa drop count.
This
Sunday was the best day we have had all year with plenty of bee activity,
lots of pollen coming in, so the next four weeks ought to show more
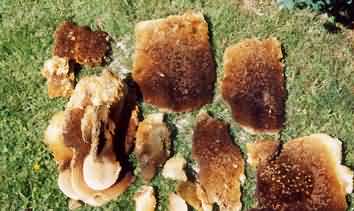
interesting graphs. I have also enclosed a photo of the natural comb
inside an 'HT' hive, actually its Hive 6. taken in 2000, the colony
that never really got off the ground.
Ist
May 2001
Please find enclosed updated graphs for the 'Varroa Experiment'
together with ten embryo bees as a sample.
I have sent these, also with some varroa samples, just to see how
they travel through the post, as future request from correspondents
will no doubt occur.
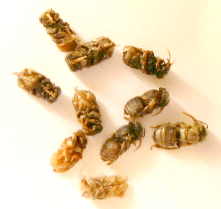
The floor debris has indicated lots of spring cleaning with the odd
dead embryo bee.
There is over 150 acres of Rape coming into flower just over 1/2 mile
away so I expect they are preparing for this sudden inflow.
31/05/2001
I do not seem to be very good at breeding varroa especially in hive
13.
There are plenty of varroa about elsewhere and I have enclosed the
graph for hive 1 as an example below. Graph updated 28/06/2001
The 138 figure for this hive on 20/5/2001 was accompanied by a
dead drone embryo of +80 so I expect that this was the reason
The photo is of my apiary at present with hives 10,13 and 15 in
the foreground which is now the main picture.
28/06/2001
Hive 15 swarmed on the 21st June and has been placed in Hive 8-1
which just happens to be the hive in the 'GM Hive Development' article.
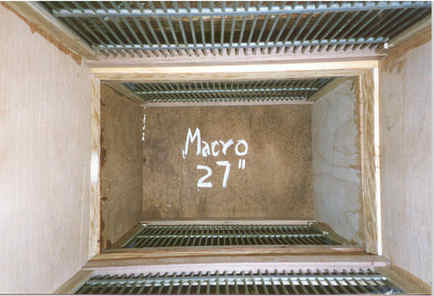
I hope to take some photographs from the bottom up to see how
the natural comb develops within the cage of the queen excluder.
The varroa drop will also be recorded to compare it with the parent
colony.
22/07/2001
New updated graphs for hives 10,13,15
Hive 10 had 36 dead embryo drones 8th July and 22 on 15th July.
The varroa drop being 62 and 61 respectively. As I have not observed
this hive swarm, I assumed that this was an indication that swarming
this year had been abandoned. This week the varroa drop rose further
to 279 with 18 dead embryo bees, 6 of which were drones.
Hive 13 swarmed on the 1st and 3rd July. The swarms were placed
in GM hives 1-1 and 7-1 both being monitored for varroa drop and photographed
for natural comb development.
Hive 15 was expected to have varroa drop peak after swarming
on the 21st June but this weeks figure was just 2. The swarm however
in Hive 8-1 counted 13.
22/08/2001
Please find enclosed graph updates for the 'Varroa Experiment'.
Hive 10.
The varroa in hive 10 have been unable to behave themselves and contain
their enthusiasm within the confines of the vertical limitations of
the graph, hence the 383 figure is somewhat up in the air. This was
accompanied with 124 dead embryo worker bees.
Hive 13.
The varroa drop for the swarms that issued on the 1st & 3rd July
have been added to the graph.
The varroa drop for the swarms is proportionally less, as might be
expected.
Hive 15.
The varroa drop for the swarm that issued 21st June has been added
to the graph. This is much higher than the parent colony.
If the peak varroa drop figures for the parent hive marked * indicate
a 4 weekly "in phase" varroa breeding cycle this could explain
the disproportionate number of varroa in the swarm.
Photographs of comb development for the above swarms inside three
types of GM hive are enclosed.
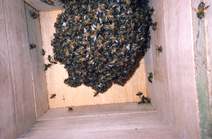 Hive
1-1 swarm from Hive 13 on 1/7/01 photo taken 22/7/01 Hive
1-1 swarm from Hive 13 on 1/7/01 photo taken 22/7/01
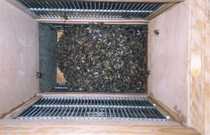 Hive
7-1 swarm from Hive13 on 03/07/01 photo taken 15/07/01 Hive
7-1 swarm from Hive13 on 03/07/01 photo taken 15/07/01
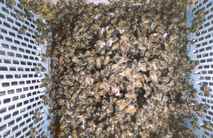 Hive
8-1 swarm from Hive 15 on 21/06/01 photo taken 24/06/01 Hive
8-1 swarm from Hive 15 on 21/06/01 photo taken 24/06/01
19/09/01
Please find enclosed graph updates for the 'Varroa Experiment'.
Hive 10.
The dead embryo bees for the past four weeks have been 54, 78, 58,
& 30. The accumulated varroa drop from 4th Feb comes to 2538.
The graph may perhaps be following a four weekly cycle as the peaks
and troughs seem to be indicating a rhythmic pattern.
Hive 13.
The accumulated varroa drop from 4th Feb comes to 1223, half that
of hive 10.
The average varroa drop for the last four weeks equals 203.
Hive 15.
The accumulative varroa drop from 4th Feb comes to 504, less than
half of hive 13.
Mites from these individual colonies have been assayed by ELISA (enzyme-linked
immunosorbent assay) for the presence of acute paralysis virus (APV),
slow paralysis virus (SPV), cloudy wing virus (CWV) and deformed wing
virus (DWV).
The work was undertaken by IACR-Rothamsted in their national survey.
Only DWV was detected in the mite samples submitted.
14/10/01
Please find enclosed graph updates for the 'Varroa Experiment'.
I have included the graphs for accumulative varroa drop for hives
10, 13, and 15. These are always interesting as they allow you to
calculate the number of varroa in the hive.
15/11/2001
Please find enclosed graph updates for the 'Varroa Experiment'.
I have included on the varroa drop graphs for hives 13 and 15 the
varroa drop for the swarms that issued from that hive. The two swarms
from hive 13 have not prospered very well with the number of bees
in each hive diminishing each week. The varroa have met with similar
success. The swarm from hive 15 has flourished together with a healthy
varroa population. Ironic as it may seem, you need a real strong colony
of bees to breed varroa.
15/12/2001
Please find enclosed graph updates for the 'Varroa Experiment'
together with the Conclusions dated December
2001.
I would like to continue the varroa drop counts into January and February
as the present figures are much higher than previously experienced
probably due to the mild Autumn.
10/01/2002
Please find enclosed updated graphs.
06/02/2002
Please find enclosed final graph updated for the 'Varroa Experiment'.
The
varroa drop figures have not decreased to the values recorded at the
same time of the previous year, suggesting that the overall varroa
population has increased.
However
if the bee population has also increased, in its second winter, by
the same
amount, then perhaps some increase may be expected.
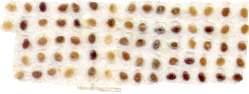
Whilst
taking measurements regarding cell size of natural Comb it became
apparent that a large amount of the comb had the hexagon flat at the
top, rather than the apex as provided in foundation.
I have enclosed a photo of such comb taken from an 'HT' hive and wonder
whether this revised cell orientation may have some anti varroa properties.
Ian Rumsey
Back
|